- May 8, 2015
- Posted by: Wevio
- Category: Sales & Marketing, Wevio Blog

According to the Survey conducted by IA, Search made up 50% of all digital ad expenditures last year in the United States. Marketing Land’s Survey about “Digital Ad Spend Hits New $49.5 Billion High in 2014; Mobile & Social See Greatest Growth.” While channels like social and mobile saw more growth, search accounted for most of the money spent overall.
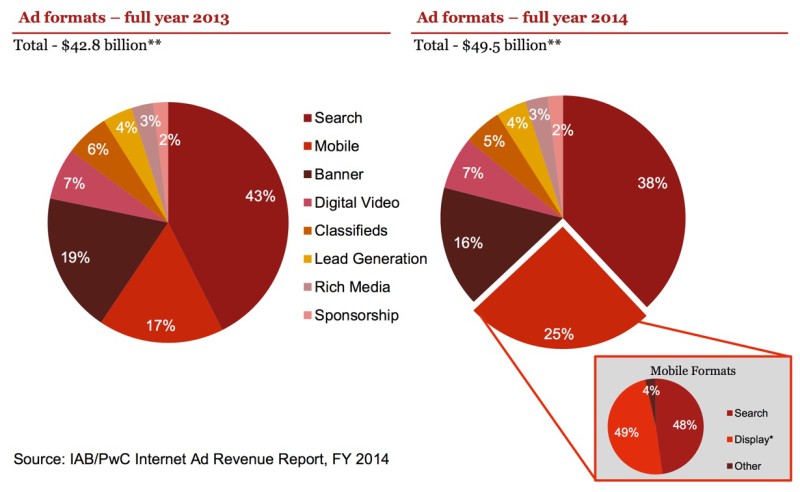
Most of webmasters and marketing gurus still work on these statistics to get some figures behind the growth of search. It’s complicated, because the IAB doesn’t release an overall “search” figure. Instead, it releases a desktop search figure that it calls “search,” which for 2014 amounted to $19 billion in expenditures, or 38% of the money spent on ads. In the ad related charts, from the IAB’s full report, you can see how mobile search is pulled out of “search” and tucked inside the mobile slice:

In that chart above, the IAB also oddly subtracts another percent from “search,” saying that search is at 37% overall versus the 38% it gives it in its press release with detailed figures.
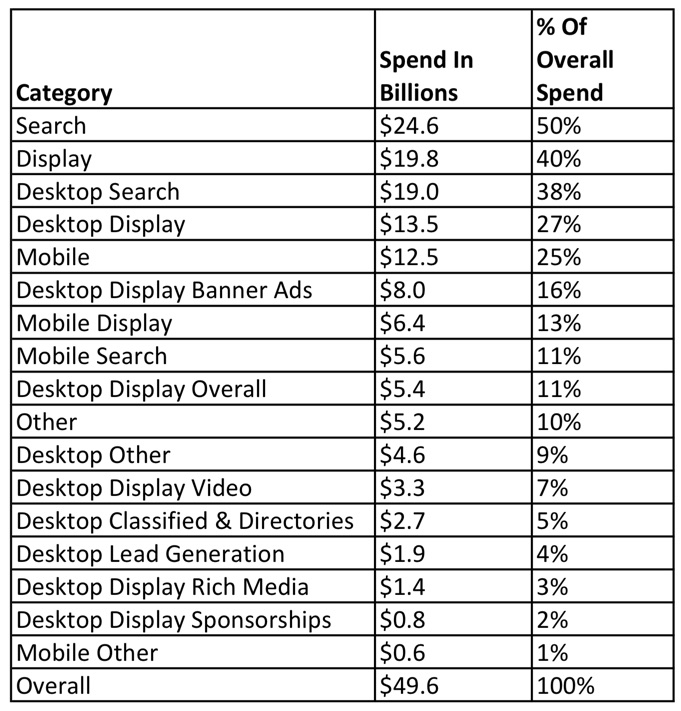
To really understand what’s going on with search, you have to do additional math to calculate the ad expenditures of mobile search, then add that to desktop search to get an overall figure. Danny Sullivan from Search Engine Land has done the calculation parts to provide a better picture of what and how ad money is being spent. Below is the calculation part, which gives us the estimated expenditure and percentage of advertising expense.

The above picture clearly explains the ad expenditure and percentages. If you add up each category, you’ll get more than 100% in total, because some categories include spending from other categories. But the percentage for each shows you how much each category amounts to versus the overall spent. For search overall, it’s 50% of overall digital ad expenditure, or $24.6 billion. Desktop search is 38% or $19 billion. Mobile search is 11% or $5.6 billion.
